ROI · 10 min read · Updated 2026-10-04
Measuring Visual Merchandising ROI: Formula, Attribution & Worked Example
How to measure the ROI of visual merchandising — the formula, why footfall is the wrong primary metric, a worked funnel from contact to sale, and how to attribute a sale correctly.
Quick answer
ROI on visual merchandising is (attributed revenue − campaign cost) ÷ campaign cost. Revenue has to come from your own CRM or sales data against a unique code or QR link — this page will not invent an average order value to force a single ROI number. What it will show is the fully computable funnel: contacts, leads, qualified leads and sales, each with a cost attached, which is the part of the formula figures.ts can actually support.
Key takeaways
- Footfall is not the ROI metric — it counts people who walked past, not people who engaged
- Leads run 8%–22% of contacts, qualify at 45%–70%, and convert to sale at 6%–18%
- Attribute every sale with a unique coupon, QR link or CRM source tag — without it, ROI is a guess dressed as a number
- Compare cost per outcome against your own channel history, not a borrowed industry average
- Review cost per lead weekly, venue by venue — a campaign reviewed only at close has already spent the budget
- The low end of every range at once is worth checking before launch, not only after a disappointing report
The ROI formula, and why footfall is not it
ROI = (attributed revenue − campaign cost) ÷ campaign cost. The formula is simple; the discipline is in the attribution, because without a way to trace a sale back to the campaign, the numerator is a guess.
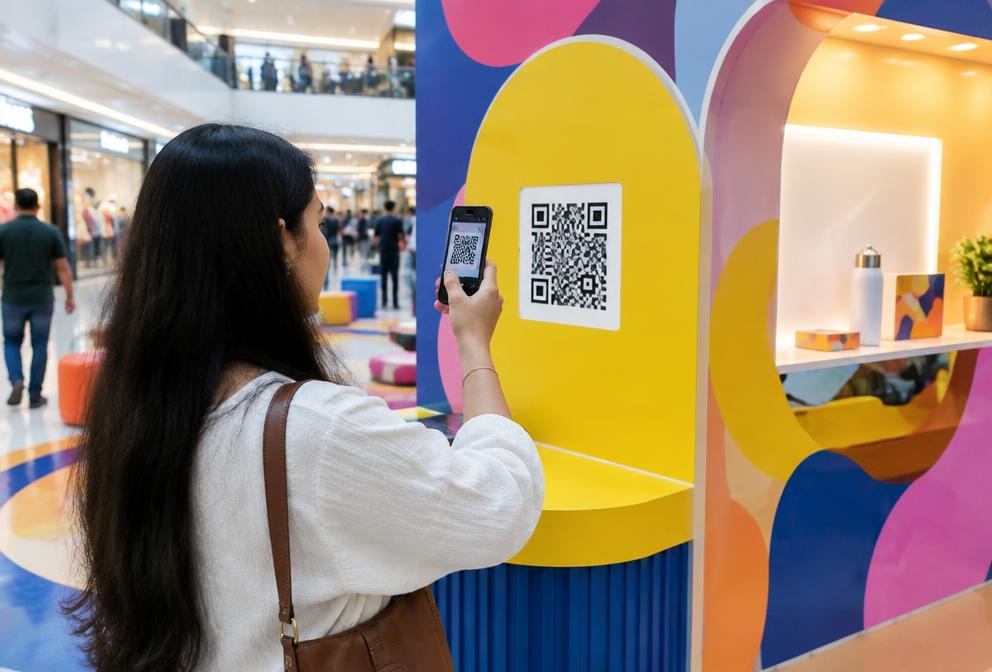
Footfall is the wrong primary metric because it counts people who walked past, not people who engaged — and the two diverge most at exactly the high-traffic venues that cost the most to book.
A retail store can show thousands of contacts on a report and still produce very few leads if nobody trained the team to ask for a number before the conversation ends; a smaller, quieter venue with a disciplined team can out-convert it on leads while showing a far less impressive contacts line. Judging the two venues on contacts alone would rank them backwards.
Worked example: cost per outcome down the funnel
Using the same 15-day pilot as the pricing and planning pages for this service, here is what each stage costs.
Reporting all three figures together, rather than only the cheapest-looking one, is what makes this table useful in a budget meeting instead of just reassuring.
Cost per outcome, 15-day pilot at a retail store
Spend ₹2,16,750 ex-GST, 3 technicians and 1 supervisor, 2,325 contacts engaged.
- Cost per lead
- ₹621
- Cost per qualified lead
- ₹1,078
- Cost per sale (30–60 day window)
- ₹9,031
24 estimated sales from this pilot, at ₹9,031 each — multiply by your own average order value, not one this page supplies, to get attributed revenue and complete the ROI formula above.
Every number here is derived from the figures.ts rate cards and funnel ranges — none of it is a market statistic, and none of it should be read as a guarantee for a specific campaign.
Completing the formula with your own one missing number
The only input this page cannot supply is average order value, because it depends on your own price list, not on anything in a BTL rate card. With that one number supplied by you, the formula from the top of this page becomes concrete using the figures already computed above.
ROI = (sales × average order value − campaign cost) ÷ campaign cost. Substituting this pilot's own numbers: (24 × average order value − ₹2,16,750) ÷ ₹2,16,750. Whatever average order value turns out to be for your product, that is the entire calculation — nothing else in it is a variable.
What happens at the low end of the range
Every figure above used the mid-point of its range. Real campaigns do not reliably land on the mid-point, so it is worth seeing what the same pilot looks like if venue response, lead rate, qualification and conversion all come in at the low end of their ranges at once — the pessimistic case, not the likely one.
Manpower cost does not move in this comparison, because it is a fixed day rate rather than a band; only the venue fee and the funnel shares shrink.
| Metric | Mid-point (shown above) | Low end of every range |
|---|---|---|
| Contacts | 2,325 | 900 |
| Leads | 349 | 72 |
| Qualified leads | 201 | 32 |
| Sales | 24 | 2 |
| Cost per sale | ₹9,031 | ₹84,000 |
Why this table matters more than the one above it
At the pessimistic end, cost per sale rises to ₹84,000 against ₹9,031 at the mid-point, from the same spend — which is the entire case for reviewing weekly rather than waiting for a final number that could land anywhere in between.
How to attribute a sale to the campaign
None of the numbers above mean anything in a real report unless a sale can be traced back to the specific venue and day that produced the lead.
Attribution set up after the campaign has already started is attribution that is missing data for every day before it was switched on, so this step belongs in the planning phase, not the first week of execution.
- Give every venue and team a unique QR code or coupon code, never a shared one
- Tag every captured lead with a source field in the CRM before the first follow-up call
- Re-check attribution at both 30 and 60 days — leadToSaleRate assumes a window, not a single-day snapshot
- Keep a geo-tagged, time-stamped photo log so a disputed attribution can be checked against who was actually on site that day
- Agree the attribution window and method with the sales team before go-live, not after the first disputed lead
What a credible report includes
A report built to survive scrutiny looks different from one built to look good on the day it is presented.
None of the items below are difficult to produce if the dashboard and attribution tags above were set up before go-live; all of them are difficult, or impossible, to reconstruct afterwards if they were not.
- A daily dashboard with venue-wise contacts, leads and exceptions
- Geo-tagged, time-stamped photos for every venue-day
- A lead list with verification status, not just a raw count
- Cost per outcome at each funnel stage, compared against the target set before go-live
- A written list of what underperformed and why, not only what beat the target
- The low-end sensitivity shown above, not only the mid-point figure
Reading cost per outcome without borrowing someone else's benchmark
The honest comparison is this campaign's cost per lead against its own history — the same venue type, the same season, the same team — not a published industry average that was never measured against your category, your cities or September to November. A borrowed number flatters or damns a result for reasons that have nothing to do with how the campaign actually ran.
Over two or three pilots, your own history becomes a far better benchmark than any external figure, because it already accounts for your category, your cities and your team — variables a generic industry number was never measured against in the first place.
This is also why the worked example on this page is tied to one named venue and one named team rather than blended into a single site-wide average — a blended number would hide exactly the venue-to-venue variation that a weekly review is supposed to catch.
Reviewing weekly, not just at the end
A campaign reviewed only at close has already spent the budget by the time a weak venue is identified. Reviewing cost per lead weekly, venue by venue, is what turns a 15-day pilot into a decision rather than a retrospective.
A weekly review is also the only point at which the low-end scenario above can be caught early enough to do something about it — reallocating a day from an underperforming venue to one that is beating its target, rather than discovering the shortfall after the budget is spent.
This does not require a new report format — it only requires looking at the same dashboard on a Friday instead of only on the last day of the campaign.
The metric to avoid
If a single number has to be dropped from a weekly report, this is the one, not leads or cost per lead.
Dropping it does not mean refusing to count attendance — it means refusing to let attendance stand in for a result.
Footfall is a venue metric, not a campaign metric
A busy mall atrium produces large footfall whether or not your activation is any good — it measures the venue's traffic, not the team's performance. Judge the team on leads and qualified leads, where the format's own execution is what moves the number.
Footfall counts people who walked past a visual merchandising setup; conversion counts the ones who stopped — a report with only the first number is measuring the venue, not the campaign.
Planning visual merchandising?
Get an itemised plan and quote from BTL Marketing Co. within 24 hours.
Frequently asked questions
How much does visual merchandising cost in India?+
Indicative pricing is ₹800 – ₹2,000 per store visit. The final quote moves with the cities chosen, the number of days, team size, fabrication and the permissions each venue needs, so ask for an itemised breakup rather than one lump-sum figure.
How quickly can visual merchandising go live?+
A single-city pilot can go live in 5–10 working days. A regional rollout across several cities typically needs 14–21 working days once permissions and fabrication are built into the schedule.
Which Indian cities can run visual merchandising?+
Visual Merchandising can be planned in any of India's 70 tracked cities, including Mumbai, Delhi, Gurgaon, Noida, Bangalore, Hyderabad, with tier 2 towns quoted on request.
How is visual merchandising different from POSM and retail branding?+
Visual merchandising is the arrangement discipline — planograms, shelf sets and audits; POSM and retail branding is the production and installation of the physical material being arranged. The two are usually commissioned together, but one is a design-and-compliance service and the other is a manufacturing and installation one.
How often does a shelf need re-auditing?+
On a fortnightly cycle for most fast-moving categories, because compliance drifts the moment a store resets stock around a reset shelf for its own convenience. A one-time shelf-set with no follow-up audit is close to worthless after the first restock.
How is compliance actually verified?+
By photo, taken at every visit and checked against the approved planogram, not by a verbal confirmation from the store. That photo record is also what makes a share-of-shelf claim defensible if a dispute comes up later.
How do I calculate ROI if I don't know my average order value?+
You cannot skip that input — it has to come from your own pricing or finance data, not an assumed figure. What you can do without it is track cost per lead, cost per qualified lead and cost per sale, which are fully computable from the campaign's own numbers and are usually enough to compare one campaign against another even before revenue is attached.
How often should a live campaign be reviewed?+
Weekly at a minimum, venue by venue — a campaign reviewed only at the end has already spent the budget by the time an underperforming venue is identified, which is the single most avoidable way to lose money on an otherwise sound plan.
Is cost per lead or cost per qualified lead the better number to report?+
Cost per qualified lead, whenever qualification is actually being done — an unqualified lead count is cheaper to produce and tells management less, because it does not distinguish a genuine prospect from someone who gave a phone number to end a conversation politely.
Does a higher cost per contact always mean worse ROI?+
No — a venue with a higher cost per contact but a much higher lead rate can produce a lower cost per lead than a cheaper venue with weak conversion, which is exactly why this page tracks cost per outcome through every funnel stage rather than stopping at cost per contact.
Visual Merchandising in top cities
More on visual merchandising
- Visual Merchandising Cost in India: Price Guide & Budget Breakdown
- How to Plan a Visual Merchandising Campaign: Step-by-Step Guide
- Visual Merchandising Ideas That Drive Sales: Proven Formats
- Visual Merchandising vs Digital Ads: Which Delivers Better ROI?
- How to Choose a Visual Merchandising Agency in India: Vendor Checklist
- Visual Merchandising for FMCG: The Complete Playbook